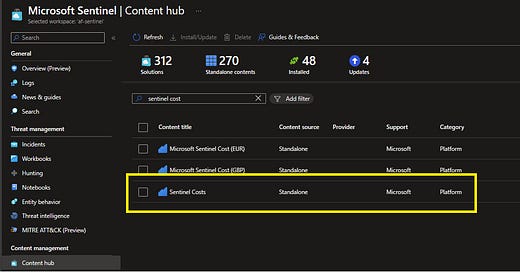
I was recently working with an enterprise that has more than 20 different Workspaces where Sentinel is deployed. They wanted to use the Sentinel Cost Workbook to view the costs of these instances individually. If you’re not familiar with the Sentinel Cost Workbook, you can deploy it from the Content Hub. Just search for Sentinel Costs and click Install.
You can use this workbook to report on estimated costs in Microsoft Sentinel including ingestion and retention. It also provides insight into the costs savings of those who receive the Microsoft 365 E5 data grant.
Microsoft 365 E5, A5, F5, and G5, and Microsoft 365 E5, A5, F5, and G5 Security customers can receive a data grant of up to 5MB per user per day to ingest Microsoft 365 data. This offer includes the following data sources:
Microsoft Entra ID (formerly Azure AD) sign-in and audit logs
Microsoft Defender for Cloud Apps Guard shadow IT discovery logs
Microsoft Purview Information Protection logs
Microsoft 365 advanced hunting data
At the top of the report, you have a few choices to make – TimeRange, Workspace (All or some), Ingestion price, Retention price, and Total seats of E5. What you select will affect the outcome below regarding cost.
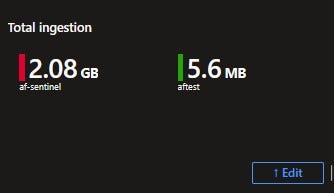
Now, that we got that out of the way, let’s talk about how to customize the report. With a little help from @rodtrent, we modified the report to show the Total ingestion, the Total Data Grant and the Estimated Saving for each Sentinel workspace.
Start by selecting “Edit”, then scroll down to the Total Ingestion section and select “Edit” again under the box.
Inside the Query section, remove the lines after the “)” and add these lines to the KQL.
| extend workspaceName = tostring(split(ResourceUri, "/")[-1])
| extend subscription = tostring(split(ResourceUri, "/")[2])
| extend resourceGroup = tostring(split(ResourceUri, "/")[4])
| summarize TotalBillableDataGB = sum(Quantity) / 1024 by workspaceName
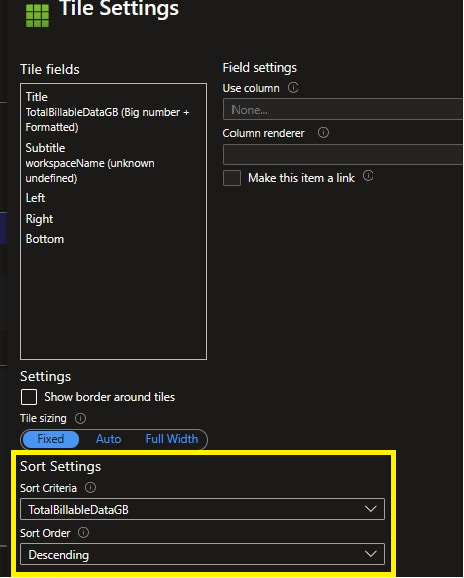
Click the “Run Query” button to make sure it works. Then select “Tile Settings” (which is to the far right of the Run Query button), scroll down to the “Sort Settings” area and under Sort Criteria choose TotalBillableDataGB. In the Sort Order dropdown, choose Descending.
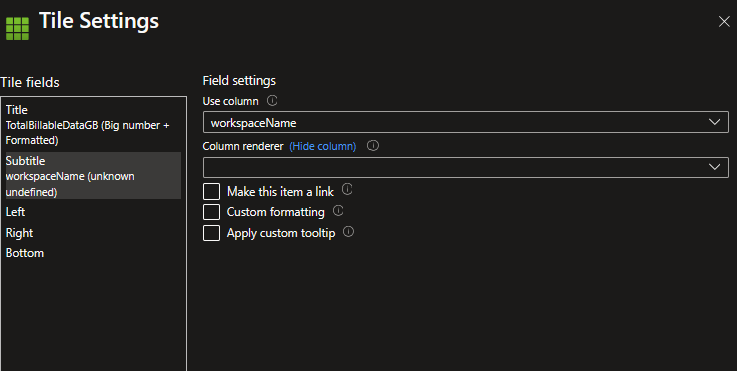
Next, in the “Tile fields” box, select Subtitle and in the “"Field settings” dropdown choose workspaceName.
Then, select “Save and Close”. And back in the Query section, pick “Done Editing”. You should now have multiple entries in Total ingestion.
Follow the same steps above to edit each section.
You’ll use this code for the Total Data Grant Limit.
| extend workspaceName = tostring(split(ResourceUri, "/")[-1])
| extend subscription = tostring(split(ResourceUri, "/")[2])
| extend resourceGroup = tostring(split(ResourceUri, "/")[4])
| summarize DailyBillableGB = toreal(sum(Quantity))/ 1024  by format_datetime(TimeGenerated, 'yy-MM-dd'), workspaceName
| extend DailyMaxGrantGB = DailyMaxDiscountGB
| summarize MaxDataGrantGB = sum(toreal(DailyMaxGrantGB)) by workspaceName
And this code for Estimated Saving.
| extend workspaceName = tostring(split(ResourceUri, "/")[-1])
| extend subscription = tostring(split(ResourceUri, "/")[2])
| extend resourceGroup = tostring(split(ResourceUri, "/")[4])
| summarize DailyBillableGB = toreal(sum(Quantity))/ 1024  by format_datetime(TimeGenerated, 'yy-MM-dd'), workspaceName
| summarize TotalEligibleGB = sum(iif(toreal(DailyBillableGB)>toreal(DailyMaxDiscountGB),toreal(DailyMaxDiscountGB),DailyBillableGB)) by workspaceName
| extend TotalDiscount = toreal(TotalEligibleGB)*{Price}
| project workspaceName, TotalDiscount
When you’re finished, don’t forget to hit the “Save” icon at the top and then select “Done Editing”.
You should now have your Sentinel Costs broken down by Workspace! Hope this helps one of you out there!


